

IntroWatch an introduction video that demonstrates the performance and some features of the Geomaris eNavigation Kernel SDK. |
Intersecting symbols cluttering the display impair the readability of a chart display. During the production of an ENC cell, sounding labels are placed at fixed positions in such a way that the cell looks clear and visually appealing and provides the desired information density. The chart display shows this desired appearance only at the particular compilation scale that the cartographer or chart production software had in mind. When zooming out the sounding labels move closer together, clutter the chart display and finally render the chart display unreadable.
Software applications displaying ENC cells suppress the sounding labels at a roughly estimated minimum scale to prevent clutter. Typically the scale at which the sounding labels disappear will be estimated from the compilation scale which is contained in the cell’s metadata.
This approach is not a satisfactory solution for a number of reasons:
- The minimum scale for suppressing sounding labels can only be roughly estimated. Besides the distribution of the soundings the symbol size used for the sounding labels is a second important parameter. If the suppression scale is too large, that means when zooming out the sounding labels are shown too long, the soundings clutter the chart display. If, to make sure to avoid clutter, the suppression scale is chosen smaller than necessary the valuable information of the sounding values is not displayed although the labels do not intersect at all or only a few do.
- Some cells unfortunately have regions with very different sounding value densities. In this case no single sounding label suppression scale is appropriate for the cell.
- The chart display of ENC data is usually composed of a number of cells. As the estimated scale at which sounding labels intersect is different for each cell at the contact line of two neighbored cells there are sharp visual contrasts where sounding labels are displayed for one cell but suppressed for the other cell. If systems seek to avoid such a situation by suppressing the sounding labels at one scale for all cells in the chart display the result will be quite inadequate for most cells at certain scale ranges.
- Suppressing all sounding labels at once at a certain scale is especially distracting during smooth zoom operations where the user reasonably expects continuous changes of the chart display. Additionally when zooming out smoothly it would also be confusing to see elements disappear from the chart display for no apparent reason.
Using Dynamic Declutter
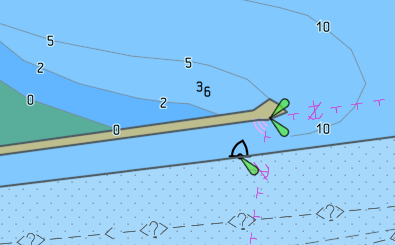
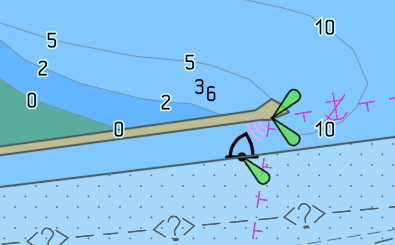
When zooming out smoothly the charting engine Despina hides sounding labels immediately before they intersect others. To ensure safety the sounding label representing the shallower depth is always shown, the one representing the greater depth is suppressed. For two soundings of the same depth the selection is random.
Unlike the smooth fading in and out for the text labels, the color of sounding labels is not altered because showing labels with transparency could lead to a situation where a shallow sounding label can be mistakenly confused with a deep sounding which should of course be avoided.
The same technique is used for contour labels.
Dynamic Declutter allows us to show smooth zoom operations and camera flights during which the chart display adapts continuously to the changing scale. The end user does not get distracted as the chart display does not change unexpectedly or abruptly but is instead consistent over time.
The IHO S-52 Presentation Library decribes the appearance of ENC charts in great detail by providing precise definitions of all symbols, colors, linestyles and fill patterns along with their alignment and drawing order. The Geomaris rendering engine displays ENC data in compliance with the latest Presentation Library Version 4.0.
For the highest quality chart display we use state of the art rendering techniques:
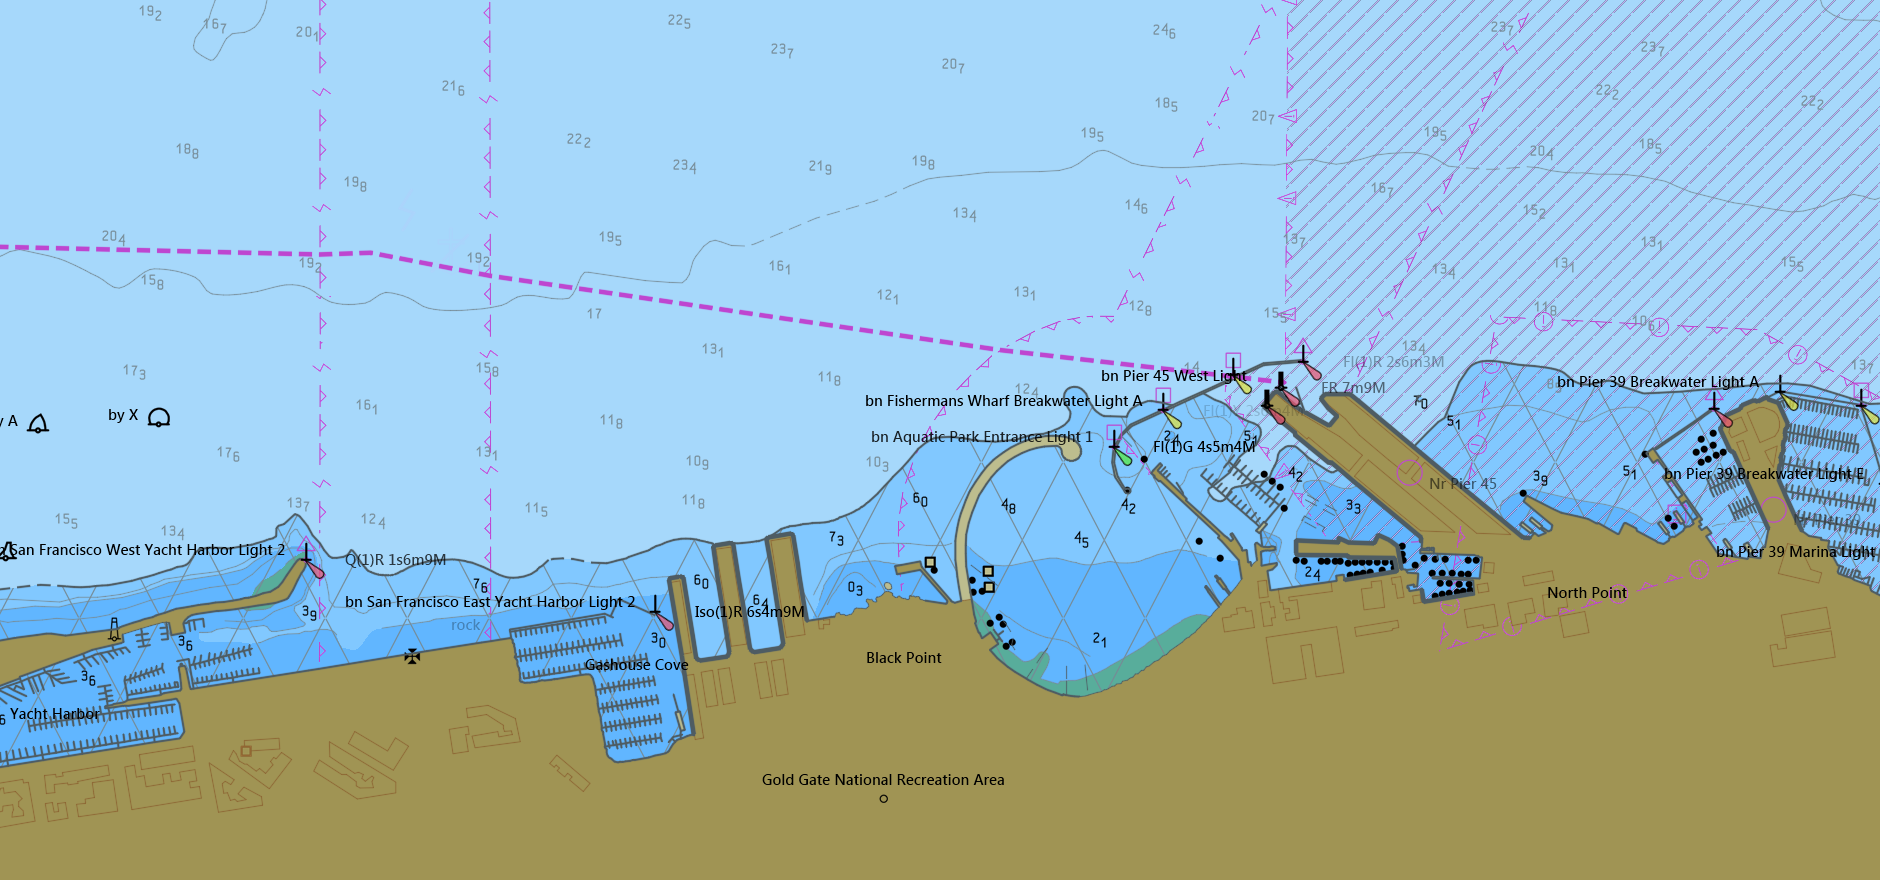
- Pure vector graphics: All visual elements - the symbols, line styles and fill patterns - are defined as vector graphics and can therefore be scaled to arbritrary sizes and for different dpi resolutions without degrading quality. Geomaris will provide a vector symbol editor for creating customized symbols, lines styles and fill patterns.
The above images show the same map section using different scale factors for symbols, line styles and fill patterns.
- Full antialiasing: All visual elements are drawn antialiased for a clear and aesthetically appealing chart display.
Dynamic Aspects
The high frame rates enable applications to support smooth zooming and camera flights. Our rendering engine provides techniques to handle dynamic aspects:
- Text labels: The Presentation Library groups text labels into text groups for selection and prioritization. When zooming out, text labels are smoothly fading out before intersecting with another text label. The text priority is accounted for to determine which of the two colliding text labels is suppressed. When zooming in, respectivley, the labels are faded in when there is enough space to show them.
- Centered symbols: The Presentation Library requires that some symbols are placed at the center of the part of an an area which is visible on the screen. These so called centered symbols do not drift or jump during zooming or scrolling. Instead after the zoom or pan operation the symbols are faded out at their old position and simultaniously faded in at the new correct position if neccessary.
- Dynamic decluttering: Our rendering engine dynamically hides sounding labels to prevent clutter. You can learn more about Dynamic Declutter here:
Learn more about the chart display apperance of the eNavigation Kernels SDK
Dynamic Decluttering is a technology for decluttering text and sounding labels on a per frame basis.
Read more about a performance comparison for some GPUs.